Application of Acrel-2000 Power Monitoring System in Science and Technology Building in Suzhou High-tech Zone
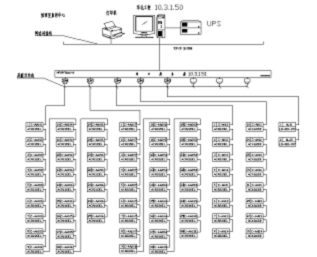
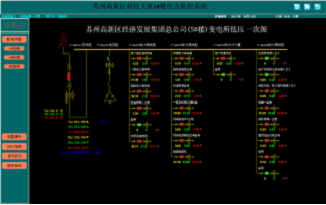
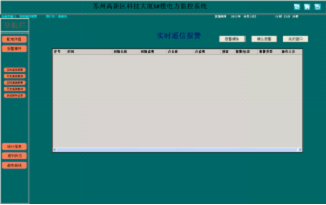
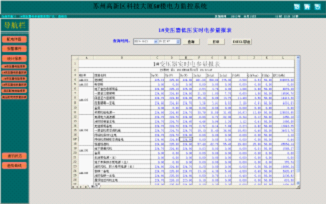
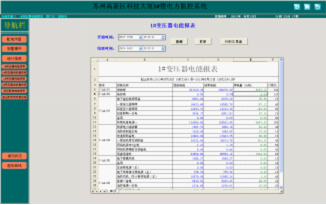
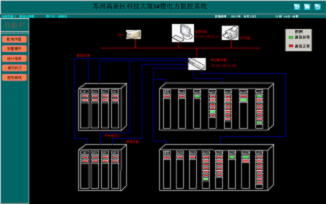
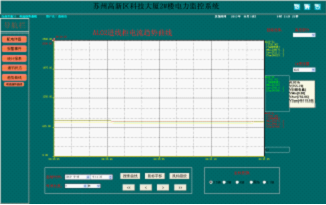
Ankerui Qingqing Jiangsu Ankerui Electric Appliance Manufacturing Co., Ltd., Jiangyin, Jiangsu 214405 , China Abstract: This paper introduces the science and technology building of Suzhou High-tech Zone, adopts intelligent power meters, and collects various electrical parameters and switching signals at the distribution site. The system adopts the on-site local networking method. After networking, it communicates via the field bus and transmits the data to the background. The Acrel-2000 power monitoring system realizes the real-time monitoring and management of the power distribution circuit of the distribution board. Keywords: High-tech Zone Science and Technology Building; Distribution Center; Intelligent Power Meter; Acrel-2000; 0 Overview Suzhou New District Science and Technology Building, with a total construction area of about 100,000 square meters, the project is building a total of 10 in Suzhou Municipal Information Center, will implement scientific management, Suzhou New District, clean and efficient service to provide basic support. The project mainly involves 9 low-voltage power distribution sections of the 9 building power distribution stations, of which the duty room is placed in the duty room of each floor power distribution station. 1 Demand analysis To ensure the statistics and analysis of the electricity load for production management and real-time monitoring of hazards. It is necessary to carry out real-time on-line monitoring of voltage, current, and power parameters of low-voltage distribution cabinets, power transformers and other electrical equipment at the production site. Once the monitoring point is monitored for abnormal parameters, the alarm can be detected in time, and the relevant personnel take necessary measures to avoid safety accidents. The automatic meter reading function saves manpower and material resources. The power trend curve function can intuitively display the working status and time of each loop, making it easy for users to find out the abnormal power circuit and carry out timely rectification. This project is a large-scale public building demonstration project. Some parameters such as electrical parameters are uploaded to the BA building automation system. This technical condition applies to the low voltage cabinet of the power distribution room in the Science and Technology Building of Suzhou High-tech Zone. The supplier's products should have high security and reliability, be easy to expand, and be easy to maintain and maintain. The product provided by the supplier shall meet at least the technical conditions, but it is not limited to this. The technical performance of the supplier shall meet the requirements for data monitoring of the power distribution room. data collection It automatically collects the analog data of all the electricity meters at the site, and automatically collects the switch data such as on-site switch status and fault status. Supports real-time acquisition, automatic cycle acquisition (timing acquisition), configurable period (1 minute to 24 hours). Support data transmission correctness test, abnormal data processing automatically. Support multi-thread processing mechanism, improve data collection efficiency, and data collection for multiple devices at the same time. The real-time display of data adopts the visual display mode of the main wiring diagram of the power distribution room, and the disconnection and fault status of each loop can be seen directly. Data analysis and processing Comprehensive statistics and analysis of data need to achieve the following functions: The statistics and calculations for hours, days, months, and years of electricity data for each device. The maximum, minimum, and average values ​​of the electrical loads (active and reactive) for each device are calculated. Statistics on the power usage (active and reactive) of each substation and the whole. Data query and display Requirements can facilitate the implementation of client inquiries and inquiries at all levels of management personnel, query interface can adapt to the requirements of all levels of management personnel can support flexible conditional combination of query and comparative analysis, various types of statistical analysis of data can be flexible to use reports and other charts Intuitive display function. The data display function is divided into three layers for operation level, management level, and decision level according to the different permissions of different users. The operation layer has functions such as energy consumption analysis, cumulative usage, real-time monitoring, operation record and ratio, comparison, and benchmarking. Management has functions such as energy statistics and analysis, comparison of classification items, and benchmarking. The decision-making level has functions such as energy consumption data analysis, data deletion, and database import/export. authority management Requirements for different users to give different roles, can be authorized to function submenu, specific file records, data records. The system requires a reasonably complete user security control mechanism, which can effectively protect the information resources in the application environment and prevent the loss, theft and destruction of information. Energy Saving Improvement and Effect Evaluation It is required to provide data support for the production of energy-saving retrofits and to provide an assessment of the effects before and after the energy-saving renovation. parameter settings Through the collection cabinet can set the loop transformer ratio, a variety of current and voltage protection settings. Fault judgment and alarm have automatic fault judgment and use sound and light alarm function. The types of alarms include switch failures, voltage and current overruns, on-site acquisition module communication failures, and monitoring system communication failures. The alarm time is automatically recorded in the system database to facilitate user inquiries. The staff can always grasp the real-time operation status of the substations, find faults in the substations and make corresponding treatment, improve the management efficiency of the substations and improve the safety of the electric power system. reliability. 2 system solutions Acrel-2000 system Acrel-According to the actual situation of the Science and Technology Building in Suzhou High-tech Zone, the overall network structure is directly connected to the data collector of the power distribution center using a shielded twisted pair and then directly connected to the monitoring host of the opening and closing station to ensure the distribution of power. The stability and real-time performance of the power monitoring system transmission. According to the customer's needs, the power distribution departments of 9 buildings in the site are opened separately to monitor the distribution status. 9 sets of system configuration are consistent and distributed in the power distribution facilities on each floor. Take the overview of the distribution center of 5# building as an example. This is illustrated in the following figure: Station control management, network communication layer, and field device layer. The field distribution F # 5 Total 59 ACR220EL divided into three RS485 bus connected to the distribution data acquisition, eight ACX6100B access an RS485 bus connected to the distribution data acquisition, two LD- B10-10F access an RS485 bus connected to the distribution of the data acquisition, data acquisition UTP cable directly connected to the monitoring host duty room. 1) Station control management Station management The management personnel of the power monitoring system are the direct windows of human-computer interaction. In the science and technology building project of Suzhou High-tech Zone, it mainly refers to the monitoring host placed in the power distribution center. 2) Network communication layer The communication layer is mainly composed of a Nport5610-8, a protocol isolation converter, an Ethernet device, and a bus network. The main function of the Nport5610-8 data collector is to monitor the field smart meters; the main function of the Ethernet equipment and the bus network is to realize the data exchange between the substation and the master station, so that the distribution system management is centralized, informatized, and intelligent. The safety, reliability and stability of the distribution system have been greatly improved and the unattended purpose has been achieved. 3) Field device layer The field device layer is a data collection terminal, which is mainly composed of smart meters. The smart meters are connected to the communication server through a shielded twisted pair RS485 interface using a MODBUS communication protocol bus type connection, and the communication server reaches the power distribution monitoring host for networking. Realize remote control. Smart meter on-site connection The on-site instrument is connected in a hand-in-hand manner through a shielded twisted pair (RVSP2*1.0). Each bus connects about 20 smart meters. Different types of smart devices are connected to different buses, and then the data is uploaded to the data. Collector Nport5610-8, and then upload the data to the local monitoring terminal. The specific connection diagram is as follows: The ACR220EL multi-function liquid crystal display instrument is used in the inlet and outlet circuits. It is a network power meter designed for the power monitoring needs of power systems, public facilities, and intelligent buildings. It can measure all conventional power parameters such as three-phase voltage and current. Active power, reactive power, power factor, frequency, active power, and reactive power. The temperature controller can monitor the temperature of the transformer in real time. 3 system function The real-time monitoring system diagram of the power distribution center is the main monitoring screen, which mainly monitors the running status of all loops in the power distribution system in real time. The red represents the closing and the green represents the opening. In the system diagram, you can intuitively see the operating parameters and status of each incoming and outgoing line. You can see all the conventional power parameters on the outgoing side of the transformer, such as: three-phase voltage, current, active power, reactive power, power factor , frequency, active power, etc. As shown below: Distribution Station System Diagram Circuit detailed electrical parameters The remote signaling and telemetry alarm functions mainly complete the monitoring of the switching operation status and load incoming line of the low-voltage outlet loops, and indicate the specific alarm position and audible alarm to the switch displacement and load over-limit pop-up alarm interface to remind the on-duty personnel to deal with it in time. The load limit can be set freely under the corresponding authority. With historical query function, as shown below: Alarm function history query The event alarm recording function mainly completes the recording of the alarm information events and the time of occurrence within the query period, provides the basis for the personnel on duty, and analyzes the causes of the accident, as shown in the following figure: Real-time query of alarm function The parameter reading function mainly inquires into the electrical parameters of the low-voltage outlet circuit. Supports electrical parameter query at any time, with functions such as data export and report printing. This report inquires the electrical parameters of each low-voltage circuit of transformer outlets of the Treasury payment center power distribution center, mainly including: three-phase current, active power, and active power. The names of the loops in this report are associated with the database to facilitate the user to modify the loop name. As shown below Electrical parameter reading The electricity consumption report function can select the time period to inquire, supports the accumulated electricity inquiry at any time, and has the functions of data export and report printing. Provide accurate and reliable power report for duty personnel. The names of the loops in this report are associated with the database to facilitate the user to modify the loop name. As shown in the following figure, the precise power consumption of the distribution circuit of the laboratory building of the office building can be displayed. The user can directly print the report and can save it in EXCEL format to another location. As shown below: Energy report The schematic diagram of the system communication structure mainly shows the networking structure of the system. The system adopts a hierarchical distributed structure and simultaneously monitors the communication status of the equipment at the bay level. Red indicates normal communication and green indicates communication failure. The following figure shows the communication status of the power distribution center. Communication structure diagram The load trend curve interface allows you to visually check the load operation of the loop. View real-time and historical trend curves, click the corresponding button or menu item to complete the switching of corresponding functions; help the user to enter the trend analysis and fault recall, with curve printing function. Provides intuitive and convenient software support for analyzing the health of the entire system. As shown below: Trend graph 4 Conclusion In the application of power distribution facilities today, the distribution security of the public office building project is of utmost importance. The application of the Acrel-2000 power management system described in this paper to the Science and Technology Building in Suzhou High-tech Zone can realize the power distribution for the power distribution station. The real-time monitoring of the power consumption of the loop can not only show the power consumption status of the loop, but also has the network communication function, and can be composed of a power management system with a communication manager and a computer. The system analyzes and processes the collected data, displays the running status of each distribution circuit in the power distribution room in real time, and has a pop-up alarm dialog, voice prompts, and a short message warning light for the closing and closing of the load, and generates various energy reports. , Analysis of curves, graphics, etc., to facilitate remote meter reading and analysis, research, the system is safe, reliable, stable, and provides a real and reliable basis for solving electricity problems in large-scale public buildings. references: [1] "Principles and Application Guide for Power Electronic Measuring Instruments", Ren Chengcheng, Zhou Zhong, China Electric Power Press [2] "Application of Power Monitoring System in Power Supply and Distribution Design", Gao Shihong, Science and Technology
Drying Machines,are the key drying machines in a washing recycling plant.
We have Vertical type and Horizontal type supply for varies kinds of plastic application like PP PE flakes/film, PET flakes drying. The strong long shaft with many paddles on it and surrounded are the mesh screeen.The rotating speed will meet 1200rpm above which will remove the high water contents in recycled materials after washing.
Drying Machines Drying Machines,Pipe Drying Machine,Plastic Drying Machine,Pipe Drying Equipment Suzhou Beakeland Machinery Co., Ltd. , http://www.beakelandpm.com